Introduction to this article:
Kernel deadlock problems are generally caused by read-write locks (rw_semaphore) and mutex locks (mutex). This article focuses on how to analyze such deadlock problems with the ramdump+crash tool.
0, background knowledge points
Ramdump is a memory dump mechanism. We can transfer the system's memory to a file at a certain time, and then import it into the memory analysis tool such as trace32 or crash together with the symbol information (vmlinux) for offline analysis. It is an important debugging method for analyzing kernel troubles such as crashes, deadlocks, and memory leaks.
Crash is an open source tool for parsing ramdump (http://people.redhat.com/anderson/). It is a command-line interactive mode that provides powerful debugging commands and is a powerful tool for analyzing complex kernel problems.
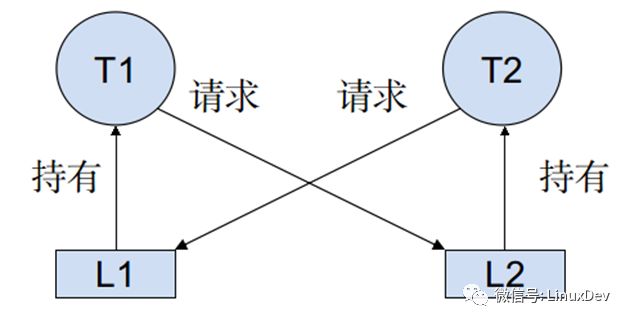
A deadlock is a blocking phenomenon caused by competing lock resources during the execution of two or more execution flows. Figure:
1, the problem description
In the Android7.1 system, when the monkey is running, the interface is stuck:
1) No refresh, all input events are invalid, including power button
2) watchdog did not restart system_server
3) can be connected to adb, but ps and other debugging commands get stuck
2, preliminary analysis
Since you can't debug directly with adb, use long press the power button to enter dump mode and export the ramdump file, then use the crash tool to load the randump file and start offline analysis.
Generally, the card may be stuck because the core thread is in the UNINTERRUPTIBLE state, so first use the ps command in the crash environment to view the thread of the UNINTERRUPTIBLE state in the phone. The parameter -u can filter out the kernel thread:
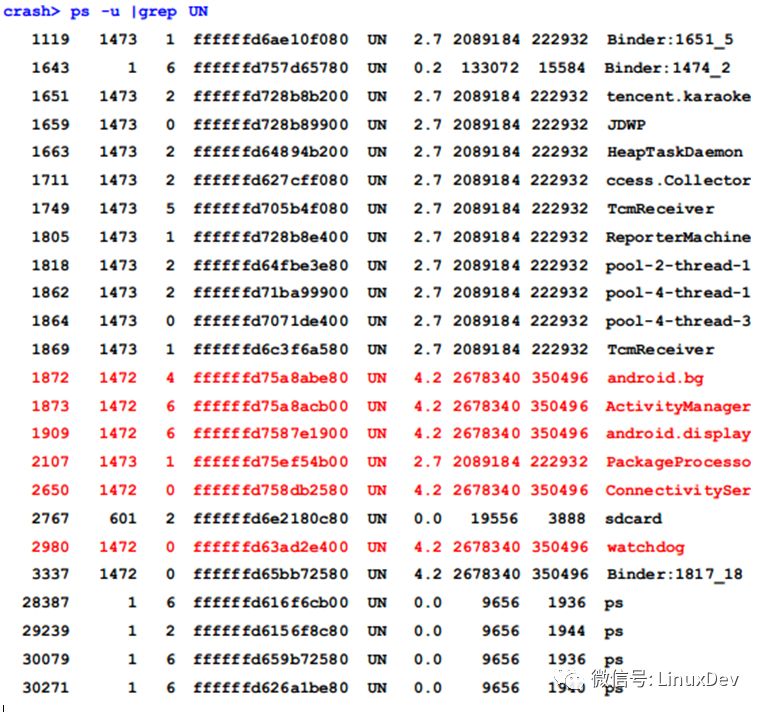
The bt command can view the call stack of a thread. Let's take a look at the most critical watchdog thread in the UN state above:
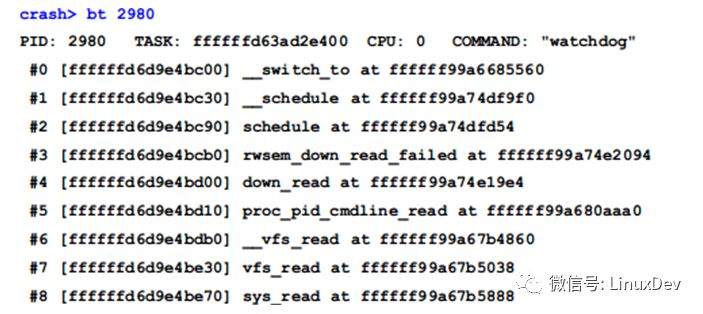
From the call stack you can see that the proc_pid_cmdline_read() function is blocked. The corresponding code is:

Here is to get the mmap_sem lock of a thread mm, and this lock is held by another thread.
3. Deriving read and write locks
To know which thread holds the lock, we must first use the assembly to derive the specific value of the lock. Use the dis command to see the assembly code for proc_pid_cmdline_read():
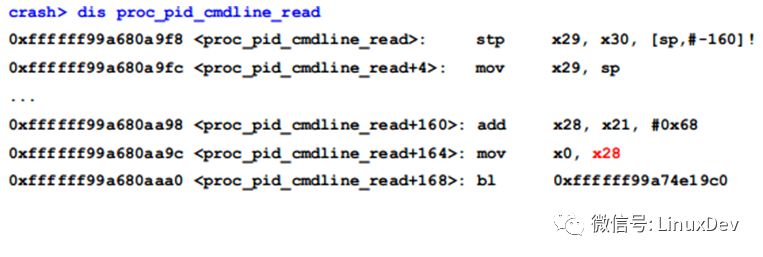
0xffffff99a680aaa0 is the place to call down_read(), its first parameter x0 is the sem lock, such as:

The x0 and x28 registers store the value of sem, then x21 is naturally the address of mm_struct, because the offset of the mmap_sem member of mm_struct is 104 (0x68), you can use the whatis command to view the declaration of the structure, such as:
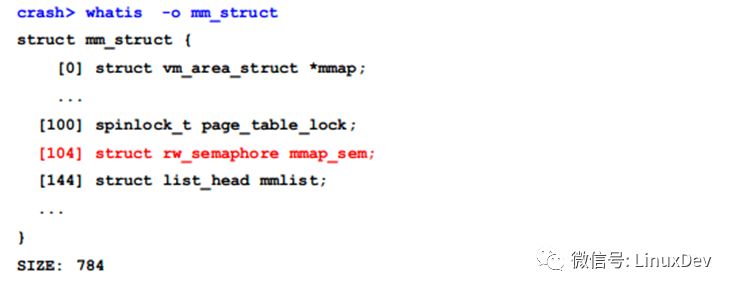
So we only need to know that x21 or x28 knows the value of mm and mmap_sem locks.
When the function is called, the called function saves the register to be modified in its own stack frame, so we can find these two registers in the down_read() and function calls after it:
In other words, in the following functions, as long as x21 or x28 is found, these registers will be saved in its stack frame.

Start by looking at the bottom of down_read():
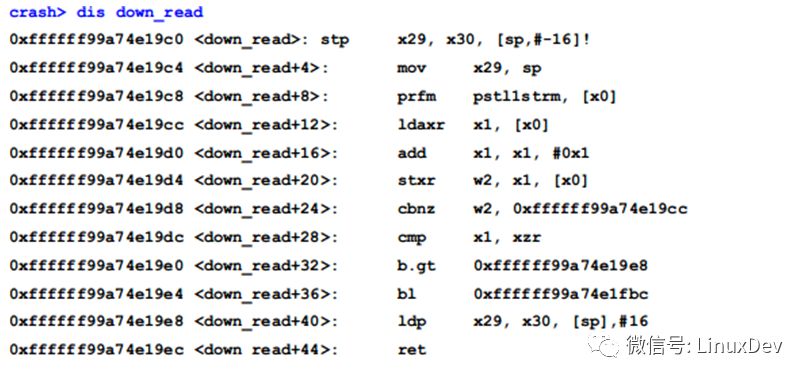
Obviously it does not use x21 or x28, continue to look at the assembly code of rwsem_down_read_failed():

Find x21 in this function, which is stored in the offset 32 ​​bytes of the rwsem_down_read_failed stack frame.
The sp of rwsem_down_read_failed() is 0xffffffd6d9e4bcb0

Sp + 32 =0xffffffd6d9e4bcd0, use the rd command to view the value of x21 stored in address 0xffffffd6d9e4bcd0:

Use the struct command to view this mm_struct:
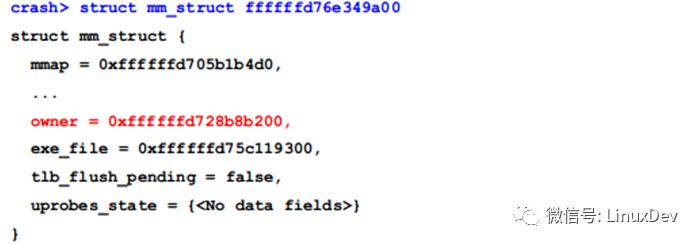
Here owner is the task_struct of the thread to which mm_struct belongs:

The address of the sem lock is 0xffffffd76e349a00+0x68= 0xffffffd76e349a68, so:
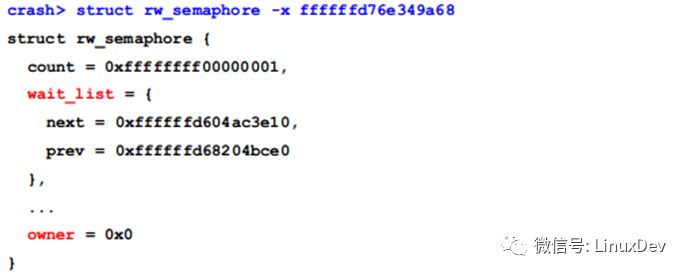
Analysis here we know that the watchdog thread is blocked when reading the proc node of the 1651 thread, because the mm of this process, its mmap_sem lock is taken by other threads, who is holding this lock? ?
4, the thread holding the read-write lock
With the problem we continue to analyze, first through the list command traversal wait_list to see how many threads are waiting for this read-write lock:
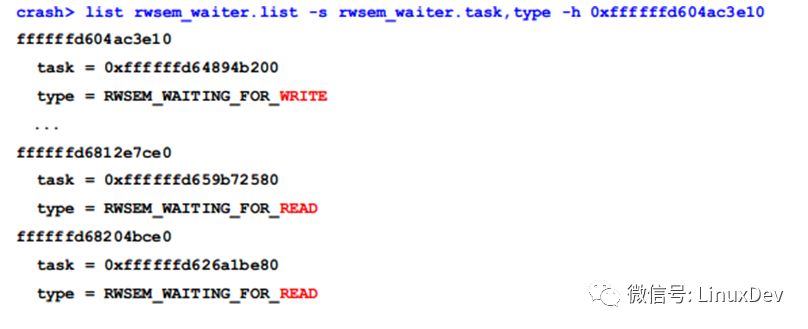
From the above output, you can see that there are a total of 2 writers and 17 readers waiting, and these 19 threads are in the UNINTERRUPTIBLE state.
Review the threads of all UNINTERRUPBLEBLE states in the current system:
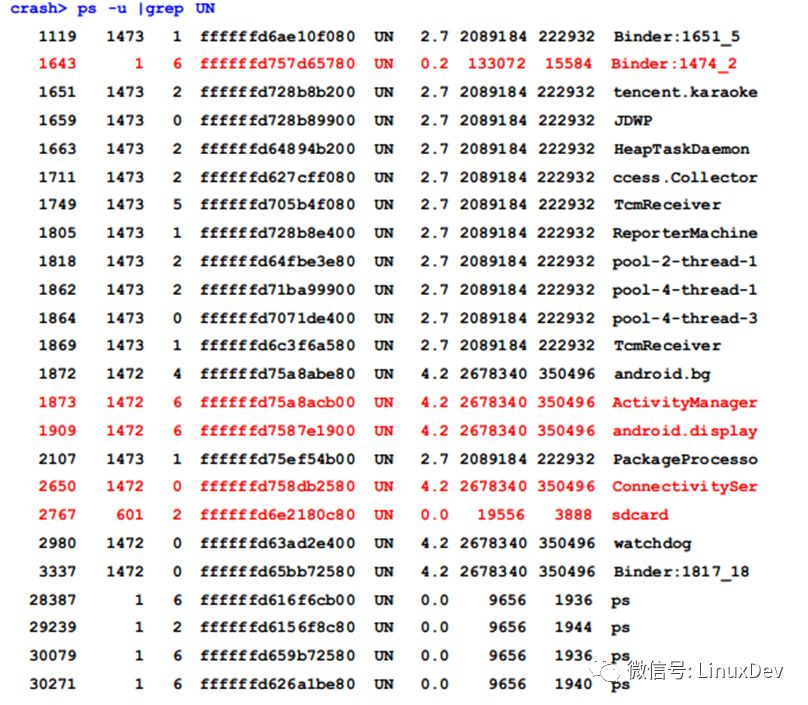
Among them, 19 threads except the 5 threads marked with red color are the threads waiting for the read-write lock mentioned above. When the lock thread is the writer, we can find the lock thread through the owner of the rw_semaphore structure. Unfortunately, the owner is 0, which means that the locker is the reader thread, so we can't find the lock thread through the owner. In this case, you can use the search command with the -t parameter to find the current lock from the stack space of all threads in the system:
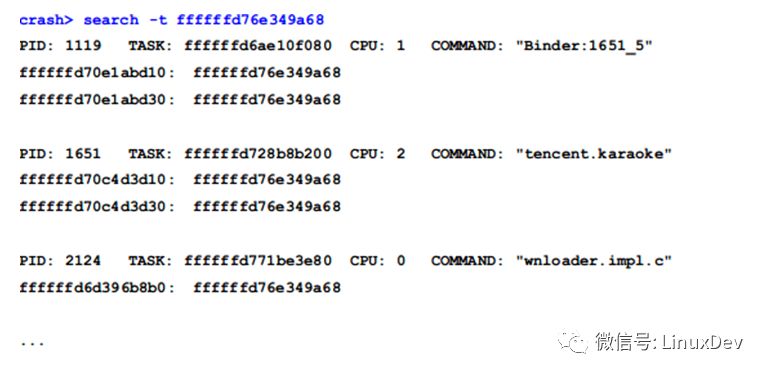
The value of the general lock is stored in the register, and the register is saved on the stack during the subfunction call. So as long as the current lock value (0xffffffd76e349a68) is found in the stack space, then this thread is likely to be holding the lock or waiting for the lock thread.
Of the 20 threads found here, 19 are the aforementioned lock threads, and the remaining one is probably the lock thread:

Look at the call stack of this thread:
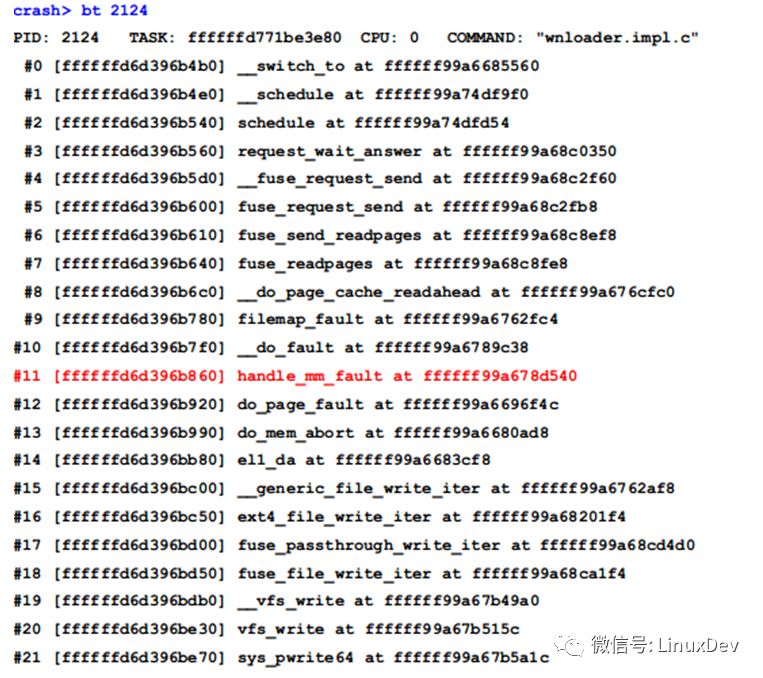
Since the address of the lock stored in the 2124 thread is 0xffffffd6d396b8b0, this is within the stack frame of handle_mm_fault(), so it can be inferred that the lock function should be before handle_mm_fault().
Let's take a look at the do_page_fault function:
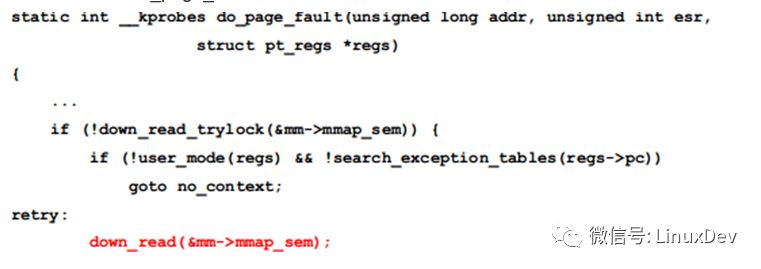
There is indeed a place in the code that holds mmap_sem and is a reader, so it can be determined that the read-write lock held by 2124 blocks 19 threads including the watchdog.
Next, we need to look at why the 2124 thread will not release after the lock is held, but before we look at the reasons for the thread blocking of several UNINTERRUPTIBLE states of system_server.
5. Other blocked threads (derivation of mutex locks)
First look at the ActivityManager thread:
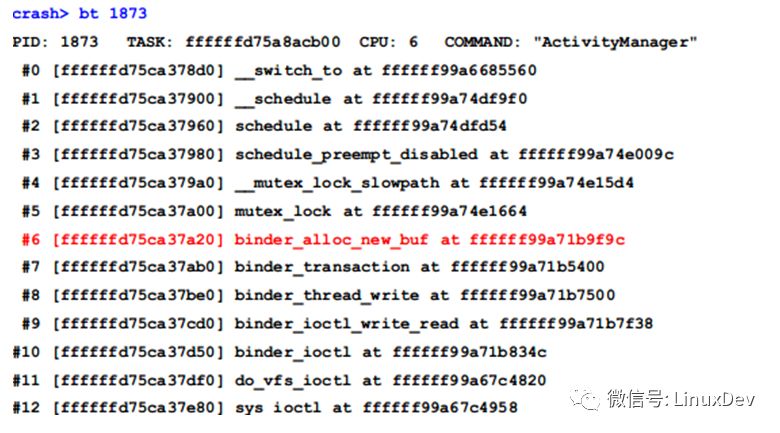
Through the call stack you can see that it was suspended at binder_alloc_new_buf, we have to find out the address of this lock first.
Start with the mutex_lock() function:

It can be seen from its declaration that it has only one parameter, which is the mutex structure pointer.
Look at the implementation of the mutex_lock function:
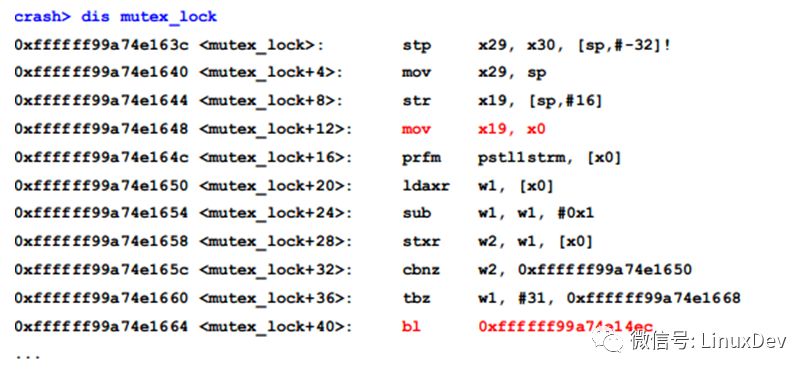
The first parameter x0 of mutex_lock is the struct mutex we are looking for, it is stored in the x19 register at 0xffffff99a74e1648, and then __mutex_lock_slowpath() is called at 0xffffff99a74e1664, so we can look for x19 in __mutex_lock_slowpath():

Since sp of __mutex_lock_slowpath() is 0xffffffd75ca379a0:

So the value of x19 is saved at 0xffffffd75ca379a0+ 16 = 0xffffffd75ca379b0

The mutex we are looking for is 0xffffffd6dfa02200:

Where owner is the task_struct pointer of the thread holding the site. Its pid is:

Look at the call stack of this thread:
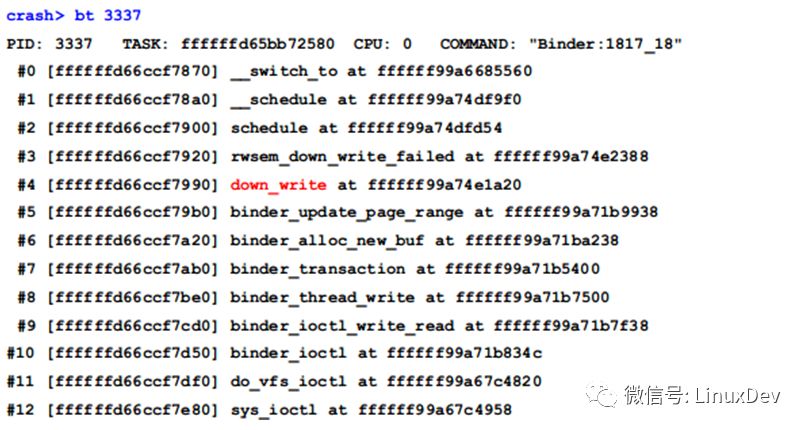
This 3337 thread is one of the 19 threads locked up by the read-write lock mentioned earlier.
Using the same method, you can find the audio server's 1643 thread, system_server's 1909, and 2650 threads are also blocked by the mutex lock held by the 3337 thread.
To sum up: 1) A total of 4 threads are waiting for the same mutex lock, the lock is 3337 threads 2) 19 threads including 3337 are waiting for the same read-write lock, and the lock is 2124 threads.
That is to say, most of the threads are blocked directly or indirectly by the 2124 thread.
6, deadlock
The last thread of the UNINTERRUPTIBLE state is the 2767 (sdcard) thread:
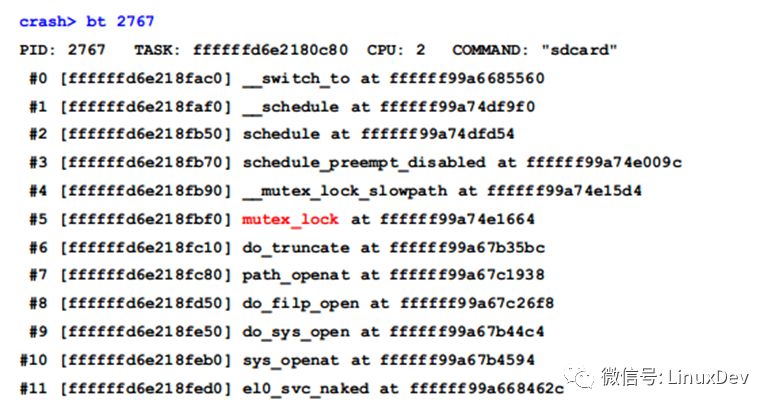
It can be seen that the 2124 thread is waiting for the result of the process, and we know that the request of the fuse is handled by the sdcard.
It's easy to think that the 2124 hang may be related to the 2767 (sdcard) thread, but the 2124 thread is doing the read request, and the 2767 thread is being suspended while processing the open request.
That is to say, the sdcard thread is not processing the 2124 thread request, but even in this case the sdcard thread can still block the 2124 thread. Because for an APP process, only a specific sdcard thread will serve it. If the same process has a multi-threaded sdcard access request, the sdcard thread will be processed serially.
If the previous request is not processed, then subsequent requests will be blocked. As with the previous mutex lock derivation method, the mutex lock waiting for the 2767 thread is 0xffffffd6948f4090.
Its owner's task and pid are:

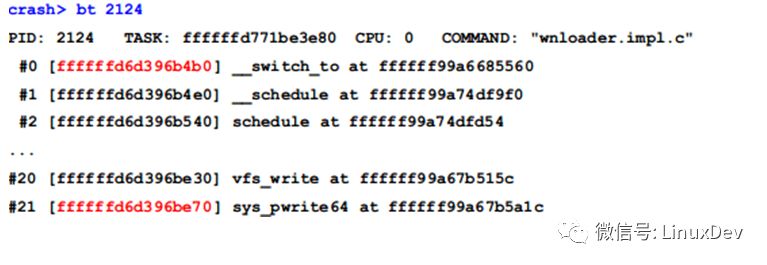
First, use the bt command to find the stack range of 2124 as 0xffffffd6d396b4b0~0xffffffd6d396be70:
Mutex can be found from the stack:
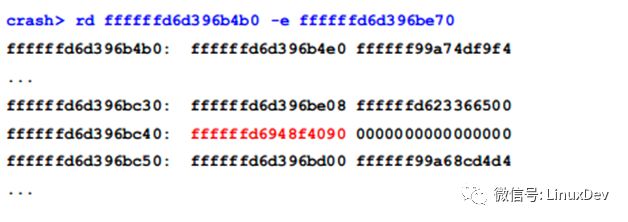
The mutex value is found at the address ffffffd6d396bc40, which is in the stack frame of __generic_file_write_iter.

That can be surely locked before __generic_file_write_iter, and most likely in ext4_file_write_iter, check its source code:

This is clear, the original 2124 is waiting for 2767 to process the fuse request, and 2767 is locked by the mutex lock held by the 2124 thread, which means that the two threads are interlocked.
This article is only limited to how to locate the deadlock problem. As for how to solve the specific implementation involving the module, the relationship between the pages will not be described here.
Dongguan Yijia Optoelectronics Co., Ltd. , https://www.everbestlcdlcm.com