An Kerui Cui Tingyu
Jiangsu Ankerui Electric Appliance Manufacturing Co., Ltd.
Abstract: The intelligent, elaborate and unattended operation of the user-side power distribution system is the inevitable trend of current distribution management. For the user-side power distribution circuit, the smart meter is designed and installed, and the background system is used to monitor the working status of each energy circuit in real time; and the power parameters of each circuit are recorded. Through the real-time monitoring of energy use and related power parameters, improving the safety, reliability and maintenance efficiency of energy use, and reducing the labor cost of maintenance, the unattended monitoring of the power distribution system has been realized. Through the use of real-time monitoring of energy, data collection and storage, the user's power usage level and the running status of the distribution system are clearly defined. This provides users with data basis for saving power maintenance costs and property management, and can also be based on the distribution system. Analyze the operational data and formulate the corresponding power distribution system maintenance plan. The ACREL-2000 power monitoring system used in the aerospace control system R&D building project will provide a brief introduction to the user-side energy use intelligence.
Keywords: space control system R&D building; substation; intelligent power meter; Acrel-2000 type; power monitoring system
0 Overview
This project is an aeronautical control system R&D building project power monitoring system. According to the requirements of power distribution system management, power monitoring must be performed on the space control system R&D building to ensure the safety, reliability, and efficiency of power usage.
The Acrel-2000 intelligent power distribution system takes full advantage of the latest developments in modern electronic technology, computer technology, network technology, and fieldbus technology, and performs distributed data collection and centralized monitoring and management of the power distribution system. The secondary equipment of the distribution system is networked, and the distributed equipment of the distribution center is connected into an organic whole through the computer and communication network to realize the remote monitoring and centralized management of the power grid operation.
1 System Structure Description
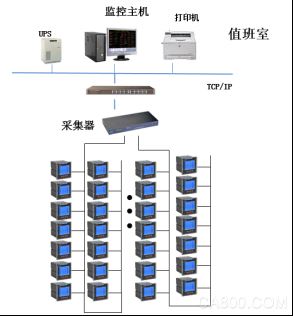
The monitoring system mainly realizes the power supply monitoring of the space distribution system of the space control system R&D building; the monitoring range is a low-voltage instrument of a substation. The system has a total of 109 meters, through the 485 bus, directly to the serial server on the 1st floor of the duty room to achieve data connectivity between the instrument and the monitoring host on the bus.
The monitoring system adopts a hierarchical distributed structure, namely station control layer, communication layer and equipment layer;
As shown in Figure 1:
Figure (1) Network topology
The main equipment layer is: Multi-functional network power meters. These devices are corresponding to the corresponding primary equipment installed in the electrical cabinet, these devices are used RS485 communication interface, through the on-site MODBUS bus network communication, data acquisition on the spot.
The main network communication layer is: serial port conversion isolator. Its main function is to collect the scattered data at the site collection device, and transmit it to the station control layer at the same time to complete the data exchange between the field layer and the station control layer.
Station control management: equipped with high-performance industrial computers, monitors, UPS power supplies, printers and other equipment. The monitoring system is installed on the computer to collect and display the operating status of the field equipment and display it to the user in the form of human-computer interaction.
The above network instruments use RS485 interface and MODBUS-
RTU communication protocol, RS485 uses shielded cable transmission, generally use two connections, the connection is simple and convenient; communication interface is half-duplex communication that both parties can receive and send data, but can only send or receive data at the same time, The maximum data transfer rate is 10Mbps.
The RS485 interface uses a combination of balanced drivers and differential receivers to enhance noise immunity.
2 main functions of the power monitoring system
2.1 Data Acquisition and Processing
Data acquisition is the basis of power distribution monitoring. Data collection is mainly accomplished by the underlying multi-function network instrumentation, realizing local real-time display of remote data. The signals that need to be collected include: three-phase voltage U, three-phase current I, frequency Hz, power P, power factor COS φ, power Epi, and communication device operation status.
The data processing mainly displays the electrical parameters collected according to requirements in real time and accurately to the user, so as to meet the requirements of automation and intelligence of the power distribution monitoring, and store the collected data in the database for user query.
2.2 Human-computer interaction
The system provides simple, easy to use, and good user interface. Using the Chinese interface, the CAD graphic shows the electrical main wiring diagram of the low voltage distribution system, shows the status of the distribution system equipment and the corresponding real-time operating parameters, the screen timing switching tour; dynamic refresh of the screen real-time; analog display; switch display; continuous Record display and so on.
2.3 Historical events
The historical event viewing interface provides convenient and friendly human-computer interaction for the user to view fault records, signal records, operation records, and over-limit records that have occurred. You can view the platform through historical events. You can easily locate your own according to your requirements and query conditions. The historical events that you want to view provide you with good software support for the overall system operation.
2.4 Database Establishment and Query
It mainly completes the remote measurement and remote signal acquisition, and establishes a database to generate reports regularly for users to query and print.
2.5 User Rights Management
For different levels of users, different permission groups are set to prevent the losses caused by human misoperation to production and life, and to realize the safe and reliable operation of the distribution system. You can use user management to perform user login, user logout, password change, and add/delete operations to facilitate user modification of accounts and permissions.
2.6 Running load curve
The load trend curve function is mainly responsible for regularly collecting incoming lines and important loop current and power load parameters, and automatically generating running load trend curves to facilitate users to know the operating load status of the equipment in a timely manner. Click the corresponding button or menu item of the screen to complete the switching of the corresponding function; you can view the real-time trend curve or historical trend line; you can perform translation, zoom, range conversion and other operations on the selected curve to help the user to enter the trend analysis and fault recall. Analyzing the entire system's operating status provides intuitive and convenient software support.
2.7 Remote Report Query
The main function of the report management program is to design the report style according to the needs of the user, and the data processed in the system is filtered, combined and statistically generated to generate the report data required by the user. This program can also be based on the needs of users on the report file to save, print. At the same time, this program also provides users with management functions for generated report files.
The report has the functions of freely setting the query time to realize daily, monthly, and annual energy statistics, data export, and report printing.
3 Case Studies
The aeronautical control system R&D building project power monitoring system includes a substation. This project aims at the power management of this substation power distribution system; remote real-time monitoring of substation high voltage distribution circuit.
The input and output circuit of the distribution center adopts a multi-function instrument. It is a network power meter designed for the power monitoring needs of power systems, industrial and mining enterprises, public facilities, and intelligent buildings. It can measure conventional power parameters such as three-phase voltage and current. , Active power, reactive power, power factor, frequency, active power, reactive power and other electrical parameters. The series of network power meters are mainly used in substation automation, distribution network automation, residential power monitoring, industrial automation, energy management systems and intelligent buildings.
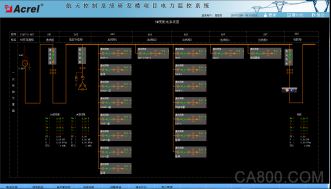
Low-voltage power distribution diagram shown in Figure (2), the function of the main telemetry power monitoring equipment operating parameters, including: line three-phase voltage, current, power, power factor, electrical energy, frequency and other electrical parameters and distribution loop three Phase current; Remote signal function Realize the running status of the display field equipment, mainly including: switch's dividing, closing running status and communication failure alarm; When the circuit breaker is dislocated, it will send an alarm signal to remind the user to handle the fault in time.
Figure (2) Low-voltage power distribution diagram
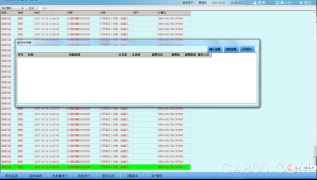
The remote signaling and telemetry alarm functions mainly complete the monitoring of the switching operation status of the low-voltage outlet circuits and the incoming line monitoring of the load. The pop-up alarm interface is displayed for switch displacement and load over-limit, indicating the specific alarm position and sound alarm to remind the on-duty personnel to deal with it in time. With real-time query function, see Figure (3).
Figure (3) Remote alarm information
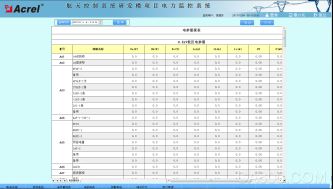
The parameter reading function mainly inquires into the electrical parameters of the low-voltage outlet circuit. Supports electrical parameter query at any time, with functions such as data export and report printing. The report queries the electrical parameters of the low-voltage loop and mainly includes: three-phase voltage, current, power factor, active power, and active power. The names of the loops in this report are associated with the database to facilitate the user to modify the loop name. See Figure (4).
Figure (4) Parameter reading
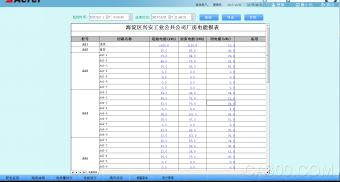
The electricity consumption report function can select the time period to inquire, supports the accumulated electricity inquiry at any time, and has the functions of data export and report printing. Provide accurate and reliable power report for duty personnel. The names of the loops in this report are associated with the database to facilitate the user to modify the loop name. As shown in the figure below, the precise power consumption of each distribution circuit in a certain period of time can be displayed. The user can directly print the report and can save it in EXCEL format to another location. See Figure (5).
Figure (5) Energy Report
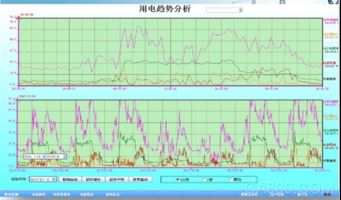
The load trend curve interface allows you to visually check the load operation of the loop. View real-time and historical trend curves, click the corresponding button or menu item of the screen to complete the switching of corresponding functions; help the user to perform trend analysis and fault recall, with curve printing function. Provides intuitive and convenient software support for analyzing the health of the entire system. See Figure (6).
Figure (6) Current Curve
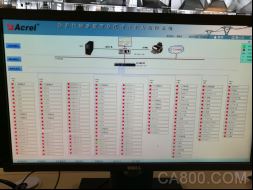
The schematic diagram of the system communication structure mainly shows the networking structure of the system. The system adopts a hierarchical distributed structure and simultaneously monitors the communication status of the equipment at the bay level. Red indicates normal communication and green indicates communication failure. See Figure (7).
Figure (7) System Communication Structure
4 Conclusion
With the development of society and the wide application of electricity, the power monitoring system has become an inevitable choice for large-scale multi-substation users, such as key construction projects, landmark buildings, and large-scale public facilities throughout the country. The Acrel-2000 power monitoring system introduced in this paper is introduced. The application of the aerospace control system R&D building project can realize the real-time monitoring and power management of substation low-voltage power distribution circuits. It can not only show the power status of the circuit, but also has network communication functions, and can be used with serial servers, computers, etc. Make up the power management system. The system analyzes and processes the collected data, displays the operating status of each distribution circuit in the substation in real time, and generates various energy reports, analysis curves, and graphs, which facilitates remote meter reading and analysis and research of electric energy. The system is safe, reliable and stable. It provides real and reliable basis for users of substations to solve electricity problems and has achieved good social benefits. [2]
references:
[1]. Ren Cheng, Zhou Zhongzhong. Principles and Application Guide for Digital Meters for Electric Power Measurement [M]. Beijing. China Electric Power Press, 2007. 4
[2].Zhou Zhouzhong, et al. Product Selection and Solution for Smart Grid User-end Power Monitoring and Power Management System[M]. Beijing. Machinery Industry Press. 2011.10
About the author: Cui Tingyu, male, undergraduate, Jiangsu Ankerui Electric Manufacturing Co., Ltd., the main research direction for intelligent building power supply and distribution monitoring system. Email:el.cn QQ Mobile Phone Fax Website: http://
16 Port USB 1U Cabinet Charger
Our new 16 port USB1U built -in charger provides the fastest charging, and is supported by tablet computers and other battery -intensive personal electronic equipment! Adopting a compact and lightweight design, without occupying position space, can be a variety of offices, restaurants, retail, education or personal devices configuration. The USB has a built -in fast charging to up to 200 watt charging power, making it very suitable for most tablet computers, smartphones, portable battery charging equipment, and most other devices that meet the USB 2.0. Our new 16 port USB charging hub station has inventory and provides free transportation for free!
Hub USB Charging Station 16 Ports 200W, 16 Port USB Charger 1U Cabinet, 16-Port USB-C HUB
shenzhen ns-idae technology co.,ltd , https://www.szbestchargers.com